Your device is sitting in a metal enclosure behind a washing machine in rural Nebraska. The LTE signal is marginal. The customer swears they “didn’t touch anything.” The device has rebooted fourteen times in the last three days and your logs say: System started.
This is the reality of field debugging. The device in your lab, the one that passes every test, is not the device in the field. And the gap between those two versions of your product is where most engineering pain lives.
The Device in the Lab Is Not the Device in the Field
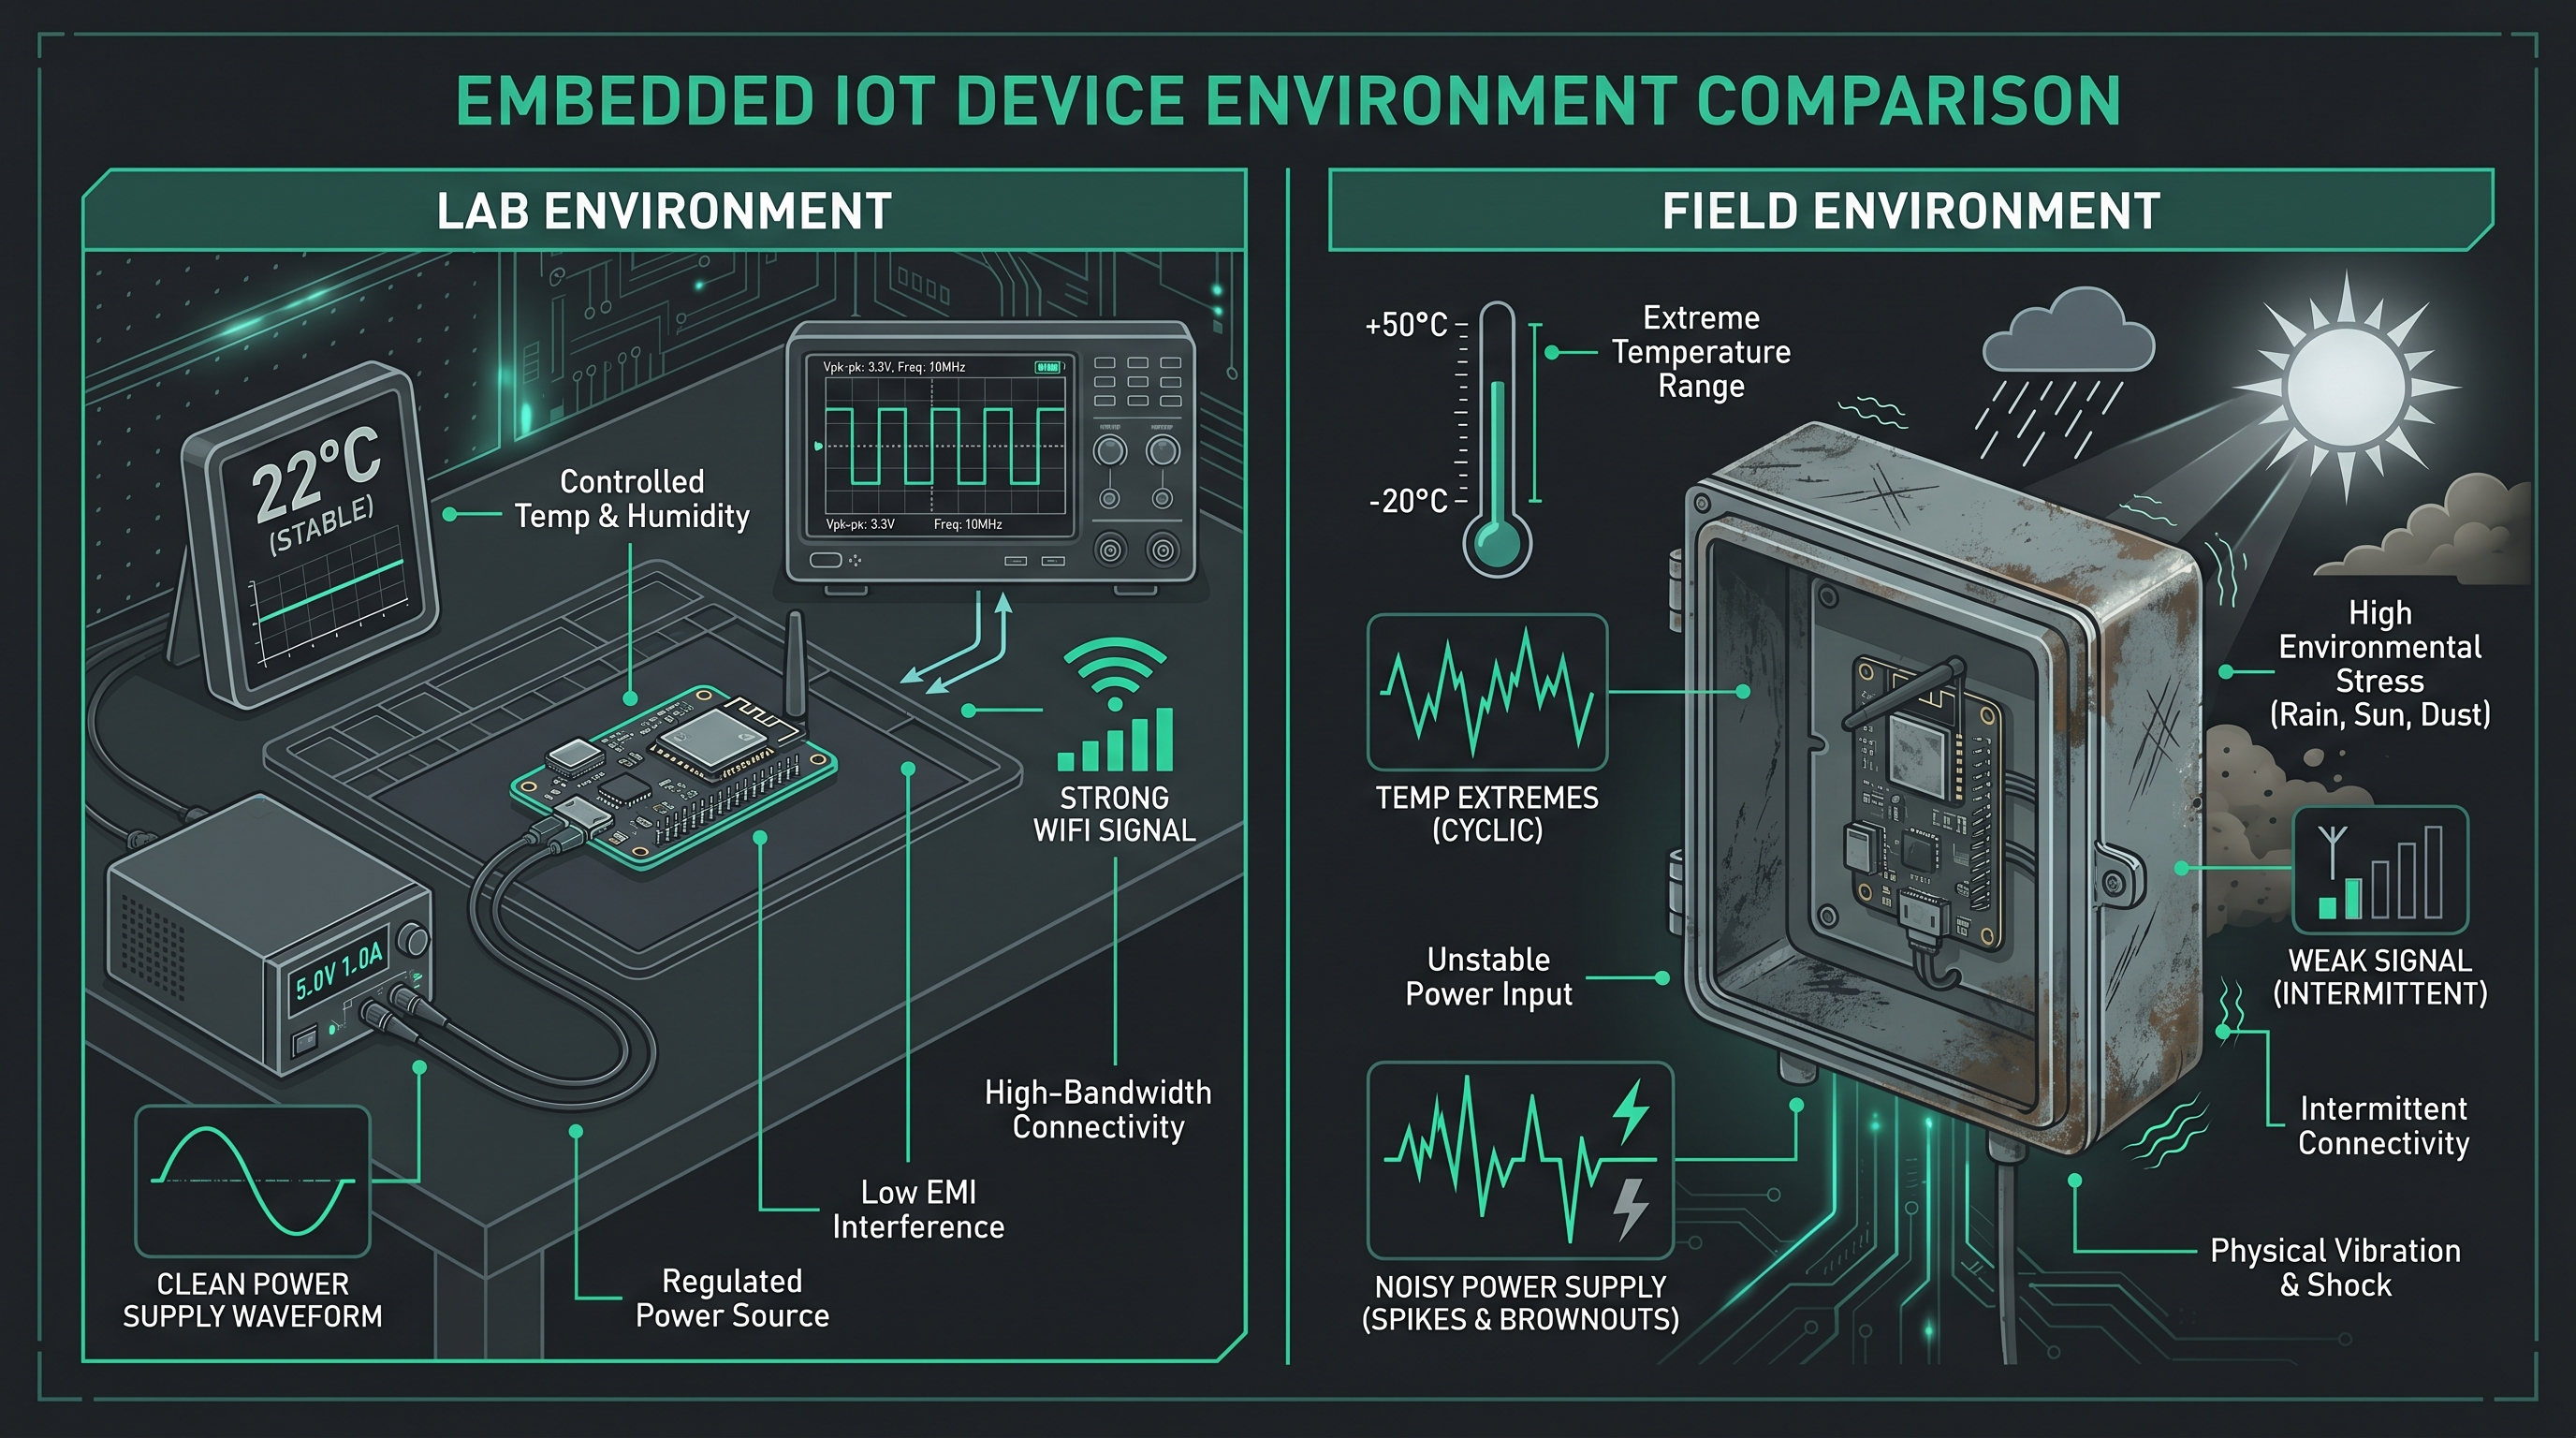
Validation environments are controlled. Temperature is stable. Power is clean. The RF environment is predictable. Configuration is known. The device on your bench behaves because you have removed every reason for it not to.
Production is different. Variability is the defining characteristic:
- Temperature swings from freezing warehouses to sun-baked enclosures
- Power supplies sag, spike, and brown out in ways your bench supply never will
- RF conditions shift constantly: congestion, interference, reflections, dead zones
- Manufacturing tolerances mean two “identical” devices are not actually identical: oscillator drift, component aging, antenna placement, battery characteristics
- Timing differences that are invisible at room temperature surface at 85°C
Field failures are usually caused by variability you did not fully anticipate. And once a device is deployed, your ability to observe what happened depends entirely on what you decided to record before you shipped it.
This is why firmware instrumentation matters. Not as an afterthought. Not as a nice-to-have. As a core part of system design.
Instrumentation Is Not Optional
There is a specific kind of despair that comes from staring at a crash report that contains a program counter, a stack pointer, and nothing else. You know where the processor was when it died. You have no idea why.
Without instrumentation, post-mortem debugging becomes guesswork: expensive reproductions that may not trigger the same fault, endless firmware revisions based on theories, and customers losing patience while you chase ghosts.
Instrument firmware assuming that eventually you will need to explain a failure you cannot reproduce locally.
This is not pessimism. This is experience talking. Every shipping product eventually encounters a failure mode that cannot be reproduced in the lab. The question is whether your firmware was designed to explain it when it happens.
A few truths that most firmware teams learn the hard way:
- Observability should be part of system design, not bolted on after the first field return
- Debugging hooks added later are always worse: they miss context, they create timing perturbations, and they require firmware updates to devices you are already struggling to reach
- You will consistently underestimate how much context you need to diagnose a problem you have never seen before
Time-Stamped Logging Is the Foundation
This sounds obvious. It is not universally practiced.
Every meaningful event in your firmware should carry a timestamp. Not because any single event is particularly interesting in isolation, but because timing relationships between events are where the real diagnostic value lives.
A sensor read that returns stale data is a curiosity. A sensor read that returns stale data 800ms after a bus reset, followed by three consecutive retries at 50ms intervals, followed by a watchdog reset, is a diagnosis.
Without timestamps, those events are just lines in a file. With timestamps, they are a timeline. And timelines are what you reconstruct failures from.
Some practical considerations:
- Monotonic timestamps are reliable for ordering events, especially across reboots
- If your system reboots, preserve the last known tick count so post-reboot logs can be roughly correlated with pre-reboot history
- In distributed systems, timestamp synchronization across nodes determines whether your cross-device correlation is useful or misleading
Most bugs are timing bugs once systems become complex enough.
Log Where Behavior Can Diverge
You do not need to log everything. You need to log where behavior can vary.
Steady-state operation, the happy path where everything works, is not where bugs hide. Bugs live at boundaries: state transitions, decision points, retry paths, error recoveries, and anywhere external input meets internal assumptions.
High-value logging points:
- Configuration changes: any runtime parameter modification, feature flag toggle, or threshold adjustment
- Wireless state transitions: connect, disconnect, roaming, handoff, signal quality changes
- Retry paths: every retry is evidence that something did not work the first time
- Sensor validation failures: out-of-range readings, CRC mismatches, timeout conditions
- Power state changes: sleep entry, wake source, brownout detection, battery threshold crossings
- OTA update state transitions: download progress, validation results, rollback triggers
- External commands: anything received from a user, cloud, or peer device
And then there are users.
Users will hold buttons too long. They will press buttons during boot. They will rapidly toggle states, operate things in unexpected order, retry operations before the first one completes, and send data that technically conforms to your protocol but violates every assumption your parser was built on.
Users are effectively random input generators with unlimited creativity and no regard for your assumptions.
Log user interactions. All of them. The input that caused the crash is almost never the input you expected.
Record Outputs, Not Just Inputs
Many systems log only what comes in. Requests received. Commands parsed. Messages decoded. This captures half the picture.
Bugs frequently occur in the gap between intended action and actual outcome. A relay command was sent, but did the relay actually switch? A motor speed was requested, but what PWM duty cycle was applied? A packet was transmitted, but was it acknowledged?
Output observability means logging:
- Actuator commands and their confirmation states
- Network transmissions and their acknowledgment status
- Storage writes and their completion results
- State machine transitions: the old state, the trigger, and the new state
- Watchdog feeds: the fact that you did kick the watchdog is as important as the fact that you eventually stopped
Think of your system as a chain:
Input → Internal Decision → Output → External EffectEvery missing link in that chain is a place where a bug can hide without being observed. The more complete your record of this chain, the faster you converge on root cause.
Pre-Trigger Logging
This is the single most impactful instrumentation pattern for field debugging, and it is underused.
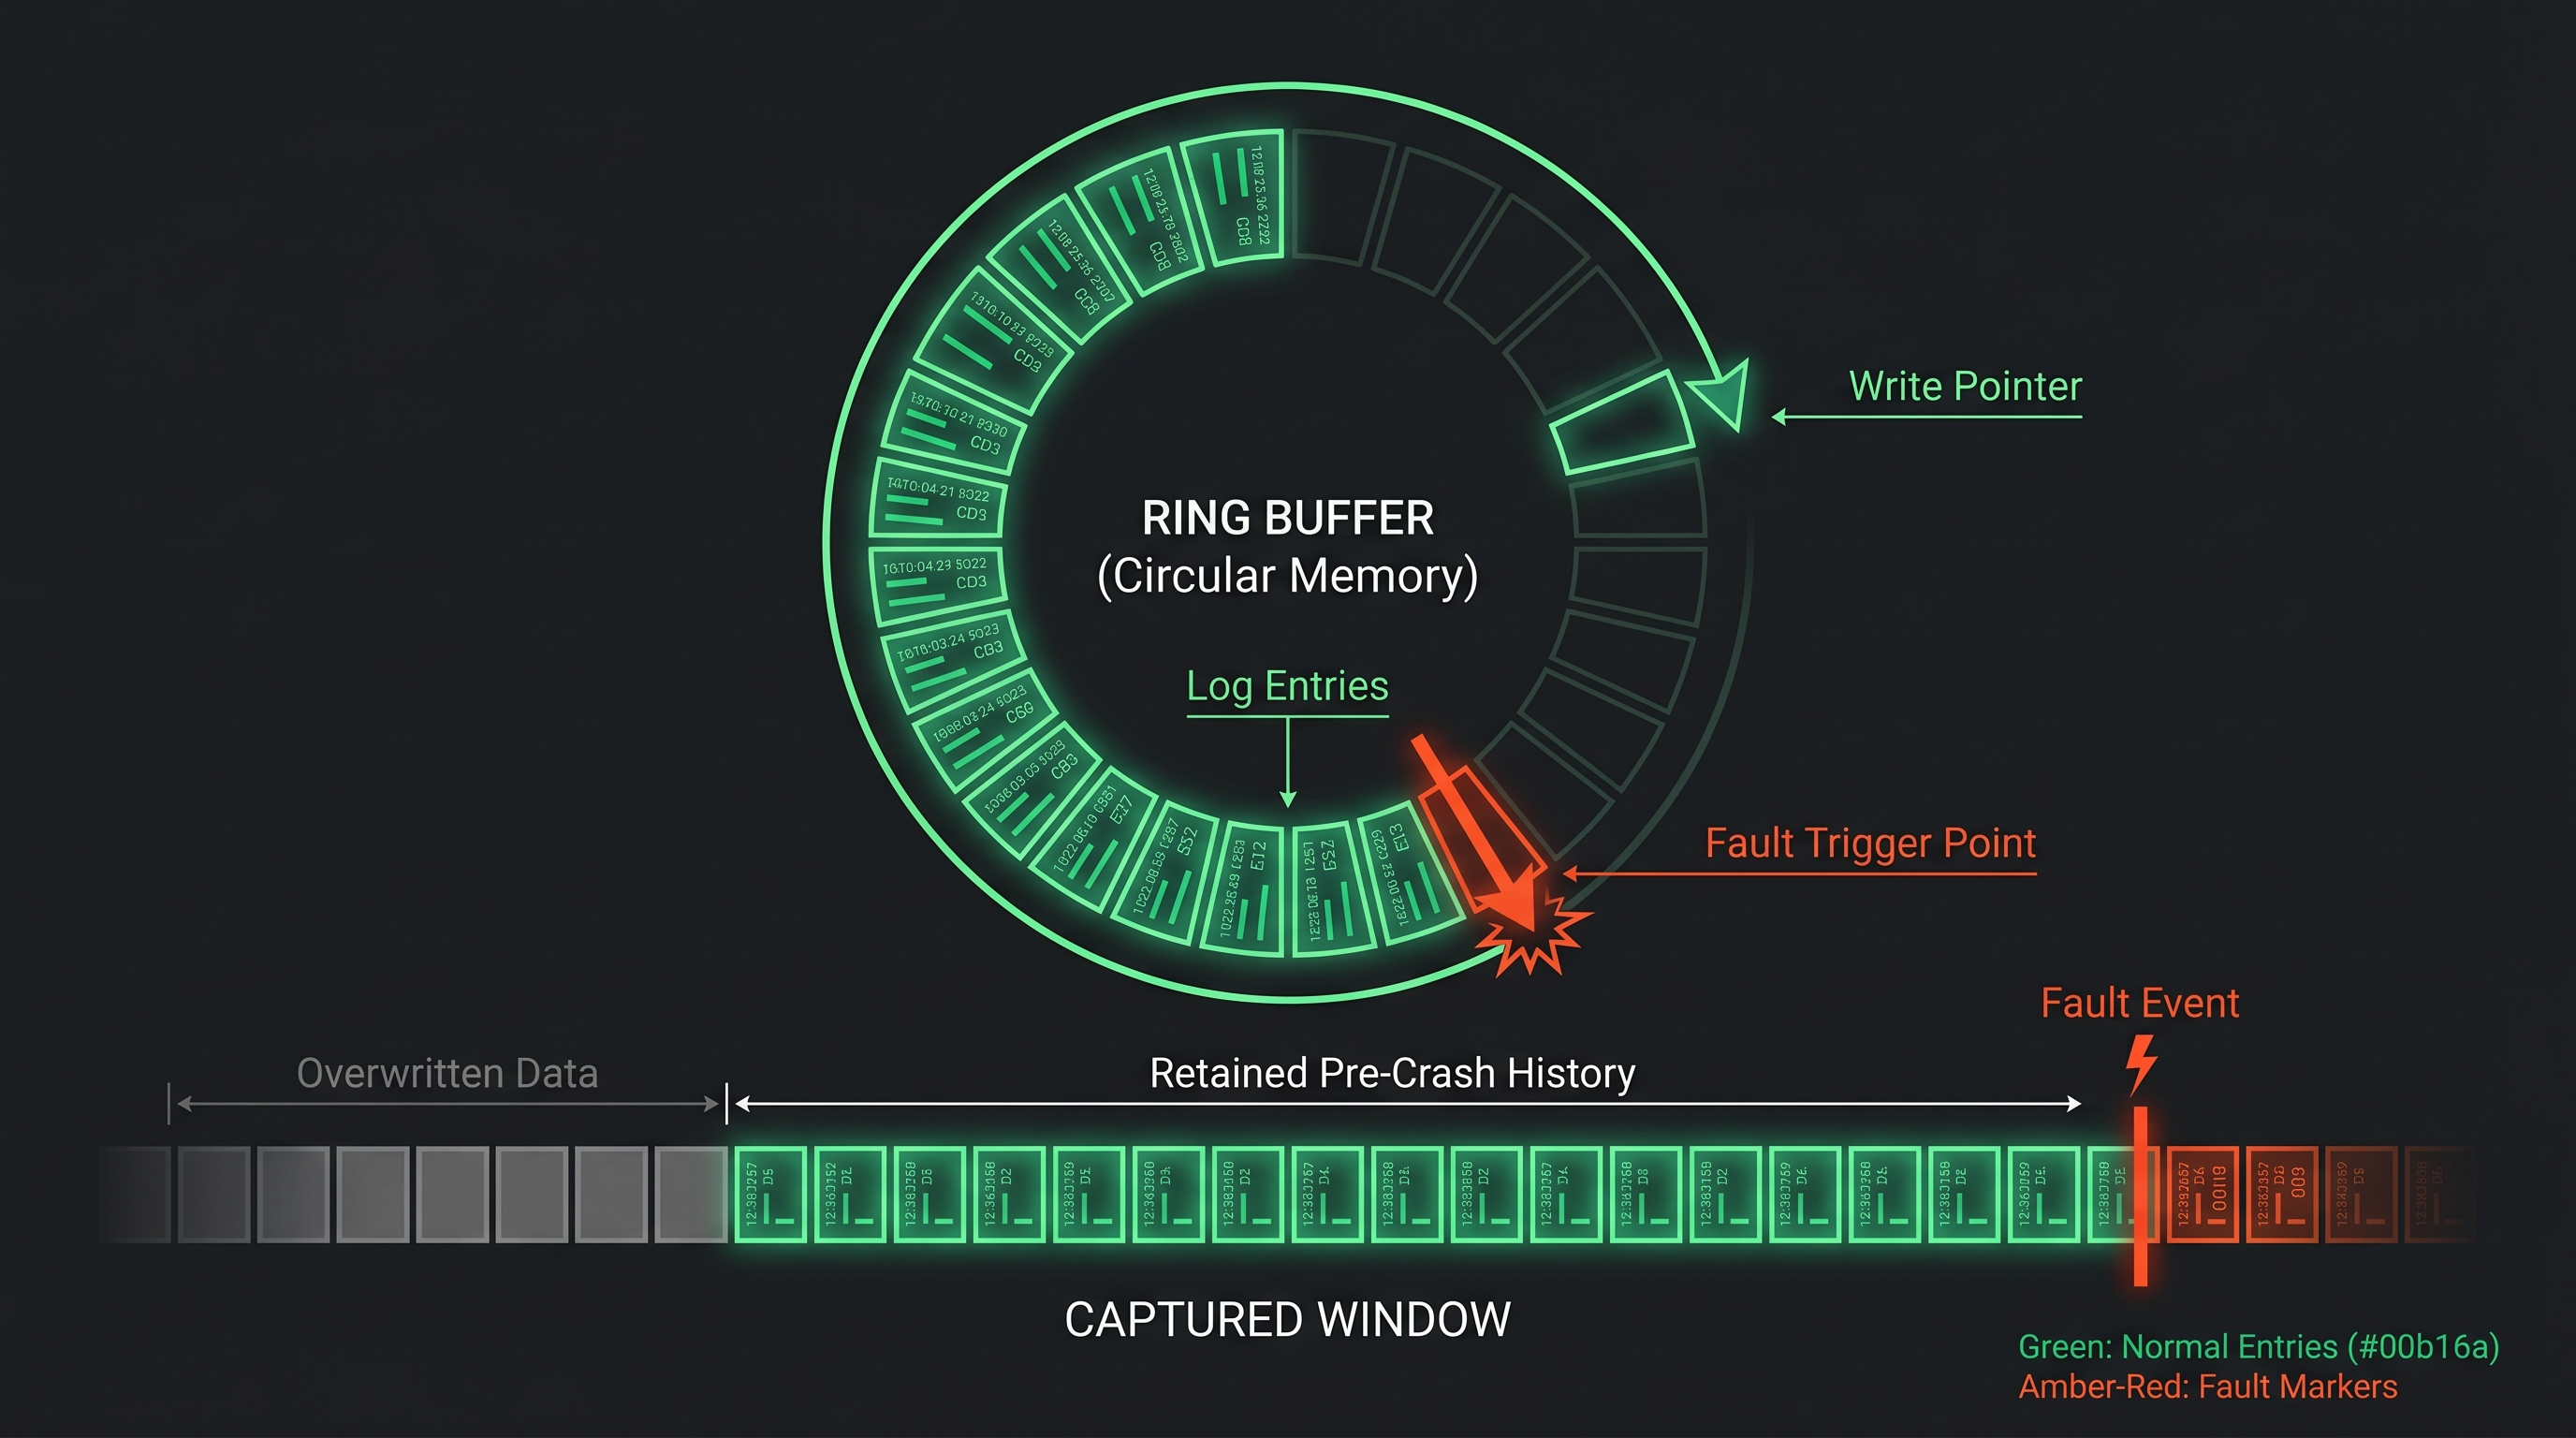
The idea is straightforward: maintain a rolling buffer of recent log entries. During normal operation, these entries are continuously overwritten. When a fault occurs, the buffer is frozen and transmitted. You get the 30 seconds, 60 seconds, or 5 minutes of history leading up to the crash.
You usually do not care about steady-state logs. Nobody needs to know that the temperature sensor returned 22.3°C every 10 seconds for six hours. What you care about is:
- The sequence of events before the watchdog reset
- The state transitions before memory corruption manifested
- The RF reconnect storm before the stack overflow
- The task switching sequence before the deadlock
The question is not “What should I log?” The better question is: “What information would I desperately wish I had after a crash?”
A ring buffer implementation is not complex. Reserve a fixed region of RAM (or better, a dedicated flash sector that survives resets). Write entries sequentially, wrapping around when full. On fault, stop writing and preserve the buffer contents.
High-value pre-trigger data:
- Recent commands received and processed
- Queue depths and high-water marks
- RSSI and signal quality changes
- Task switch history and timing
- Retry counts and failure reasons
- Packet transmission results
- Sensor state transitions
Pre-trigger logging solves a practical problem too: bandwidth and storage. You can log at high verbosity locally without transmitting anything during normal operation. Only when something goes wrong does the data leave the device. This is dramatically more efficient than streaming verbose logs continuously. Platforms like uLogger can ingest these pre-trigger buffers alongside your regular telemetry, giving you a unified timeline of both steady-state behavior and the events surrounding faults.
Crashes Rarely Happen at the Root Cause
This is one of the most important things to internalize about embedded debugging, and one of the reasons pre-trigger logging matters so much.
A hard fault at address 0x0800_3A2C tells you where the processor gave up. It does not tell you what went wrong. The actual root cause may have occurred minutes earlier: a buffer overrun that corrupted a pointer, a race condition that left a shared resource in an inconsistent state, a queue that silently dropped entries until a downstream consumer starved.
Memory corruption is the classic example. The write that corrupts the data and the read that finally crashes on it are often separated by thousands of instructions and significant elapsed time. Without historical context, you are left staring at a crash location that has no logical connection to the actual defect.
The location of the crash is often just where the system finally gave up.
This is why crash handlers alone are insufficient. A crash handler captures the moment of death. Pre-trigger logging captures the story of how you got there. Both are necessary. Neither is sufficient alone.
Design for Correlation Across Systems
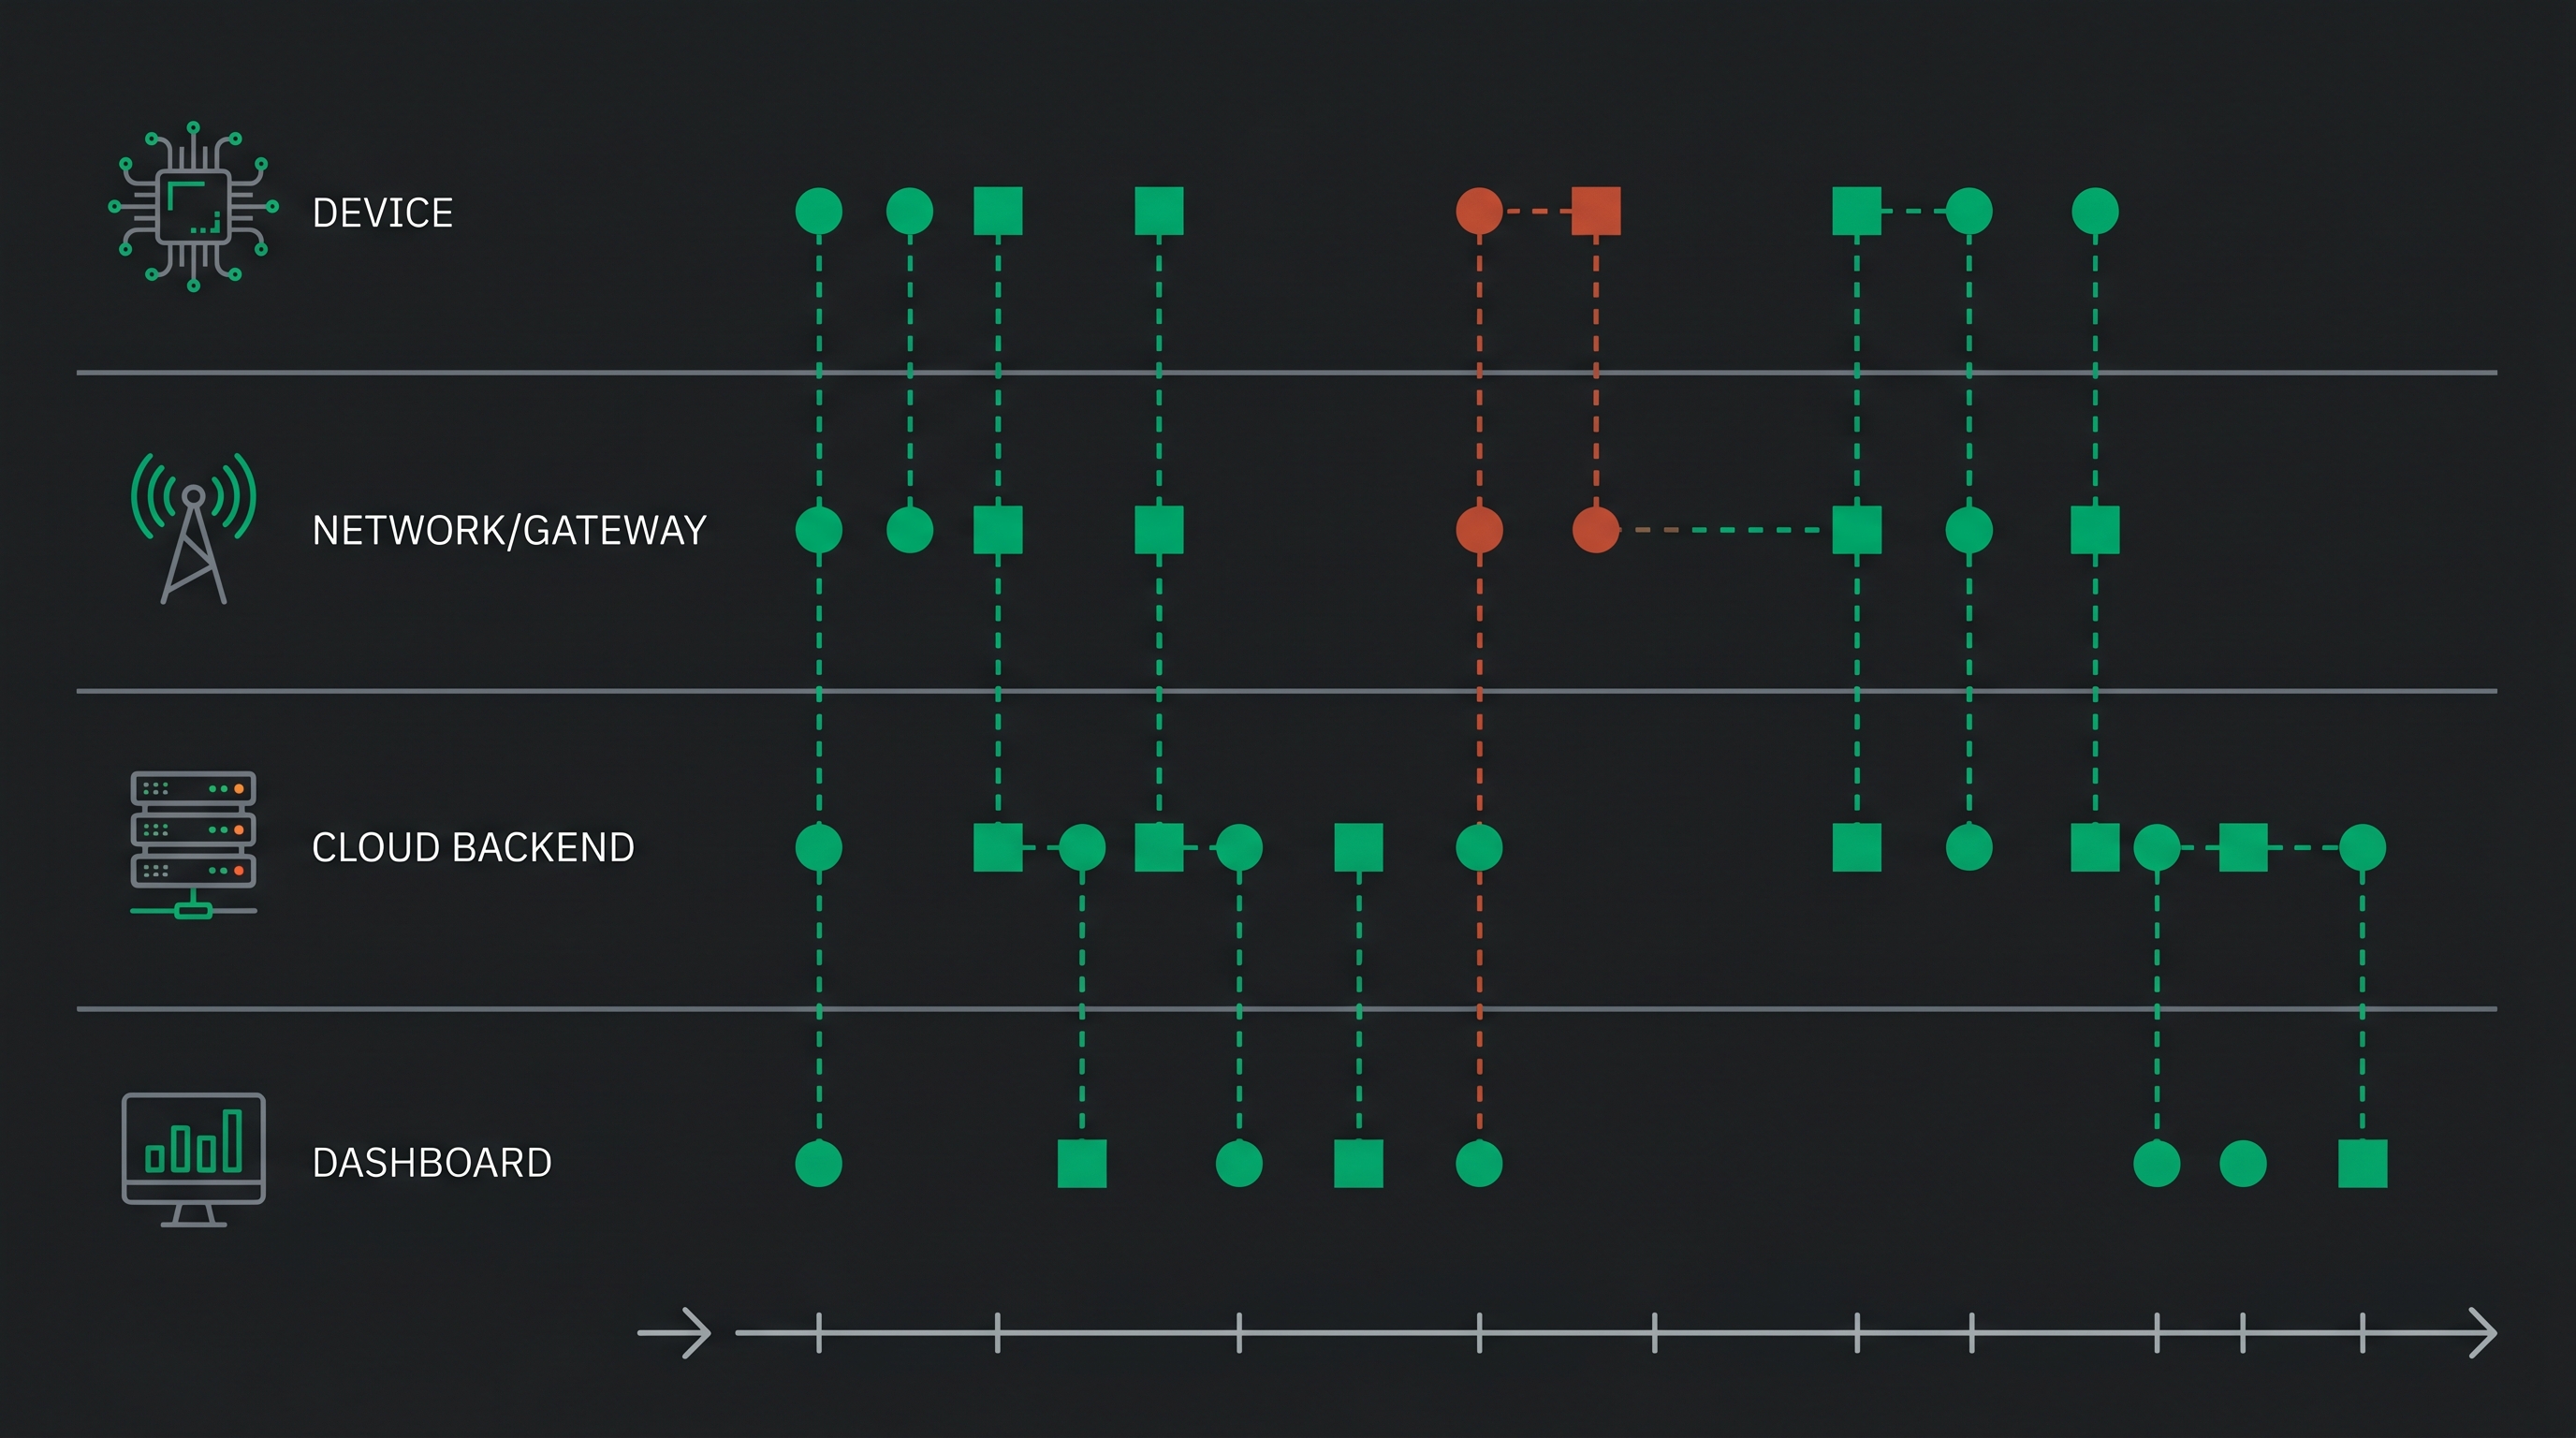
Modern IoT deployments are not single-device systems. A typical data path crosses the embedded device, a wireless network, possibly a gateway, and one or more cloud services. A failure at any point in that chain can manifest as symptoms elsewhere.
A device that “stops reporting data” could be:
- A firmware crash (device-side)
- An RF connectivity loss (network-side)
- A gateway queue overflow (gateway-side)
- A cloud ingestion failure (backend-side)
- An expired certificate (infrastructure-side)
Without correlated timelines across all of these layers, you are guessing at which system is actually at fault. With synchronized timestamps and correlation identifiers, you can reconstruct the full path of a request or data point and identify exactly where it diverged from expected behavior.
This is where composite observability becomes critical. Device logs, gateway logs, cloud processing events, and network metrics need to be queryable on a single timeline. Not in five separate dashboards requiring manual timestamp matching.
Common Instrumentation Mistakes
A quick inventory of anti-patterns, collected from production firmware that taught someone a painful lesson:
- Logging only errors. If you only log failures, you have no baseline of normal behavior to compare against. You cannot determine that something is abnormally slow if you never recorded how fast it was supposed to be.
- Missing timestamps. Discussed above. Still seen constantly.
- No persistent crash history. If your crash data lives only in RAM and you do not preserve it across resets, every reboot destroys the evidence.
- Excessive logging with no structure. Dumping
printfstrings is not observability. Structured fields (level, module, timestamp, key-value pairs) enable filtering and aggregation. Raw strings enable reading. - No correlation identifiers. Without a way to trace a request or event across system boundaries, cross-system debugging becomes manual timeline archaeology.
- Logging strings but not state. “Error occurred” is a log entry. “MQTT publish failed, state=RECONNECTING, retry=3/5, rssi=-87 ” is diagnostic data.
- Not logging configuration changes. If you do not know what configuration was active when the fault occurred, you cannot rule it out as a contributing factor.
- Losing logs during reboot. The most valuable logs are the ones generated immediately before a crash. If your logging system does not survive resets, you lose them every time.
- Dynamic allocation inside the logging system. Your logging infrastructure should not be a source of failures. Use static buffers. Allocating memory inside a fault handler is a recipe for recursive faults.
- Blocking log transports. If transmitting a log entry blocks the application, your instrumentation is perturbing the system it is trying to observe. Log to a local buffer; transmit asynchronously.
Build Systems That Explain Themselves
Debugging speed directly impacts engineering velocity. Every hour spent guessing at a field failure is an hour not spent building the next feature, improving reliability, or shipping the next product. Good instrumentation is a force multiplier.
It also changes team confidence. When engineers know their firmware will capture the context needed to diagnose failures, they make different design decisions. They ship with more confidence. They respond to field issues faster. They stop dreading the phrase “we have a customer escalation.”
The best firmware teams are not the teams that avoid failures. They are the teams that can quickly understand them.
Field debugging should not depend on luck. It should depend on engineering decisions you made before you shipped.
Instrument your firmware like you know something will go wrong. Because it will. And when it does, the difference between a one-hour diagnosis and a three-week investigation is the data you decided to record today.